New SigmaPlot Version 16
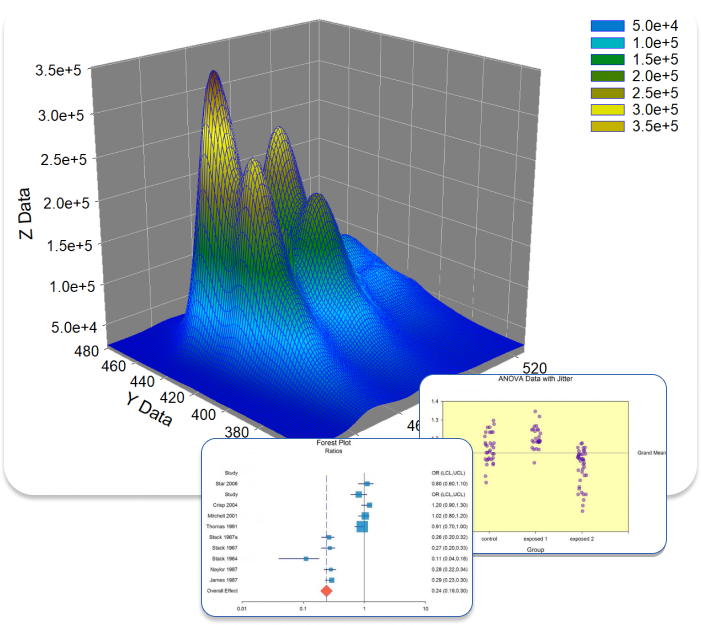
SigmaPlot is a powerful and versatile scientific tool for Data analysis & visualization.
Designed specifically to meet the needs of Scientists, Professional Researchers and Engineers.
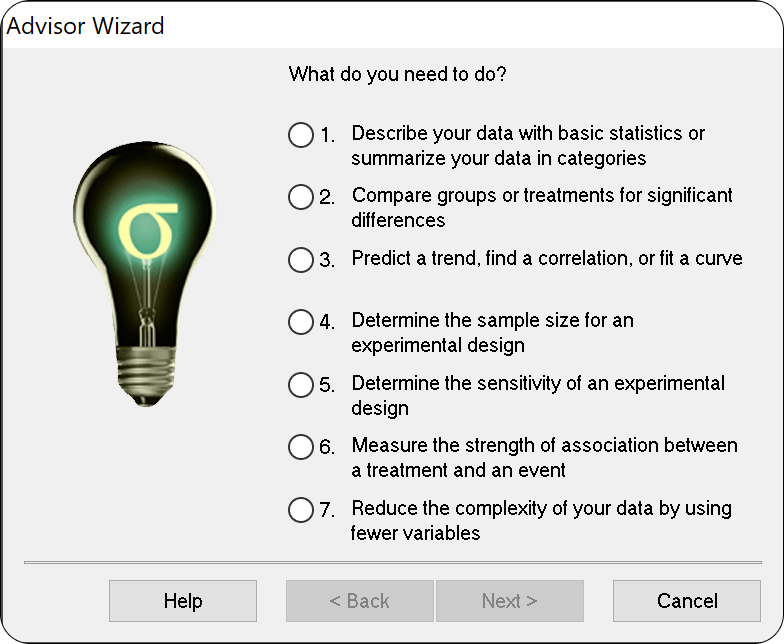
With an award-winning interface and intuitive wizard technology that guides users step-by-step through the graph creation and data analysis process, SigmaPlot provides the flexibility to create compelling graphs and statistical analysis you simply can’t achieve with basic spreadsheet software. It's also a good choice for students who are taking science or engineering courses, as it can help them learn about data analysis and visualization techniques.
정확한 그래프를 빠르게 생성할 수 있도록 도와주는 시그마플롯
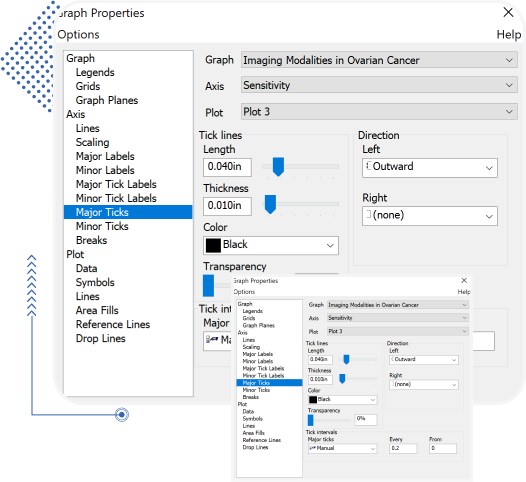
새로운 그래프 속성 사용자 인터페이스를 사용하면 왼쪽 트리에서 속성 카테고리를 선택한 다음 오른쪽에서 속성을 변경할 수 있습니다.
100개 이상의 2D 및 3D 기술 그래프 유형
간단한 2D 산점도부터 매력적인 윤곽선, 새로운 레이더 및 도트 밀도 도표까지, 시그마플롯은 까다로운 연구에 필요한 정확한 기술 그래프 유형을 제공합니다.