SigmaPlot Helps You Quickly Create Exact Graphs
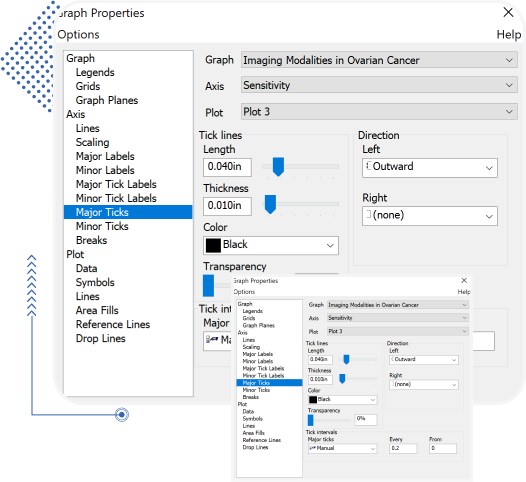
With the new Graph Properties user interface you can select the property category in the tree on the left and then change properties on the right.


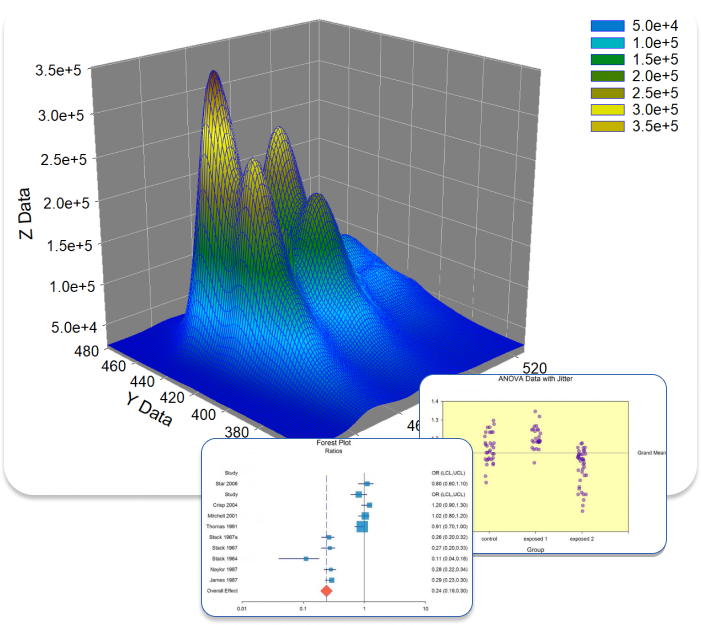
More than 100 2-D and 3-D technical graph type
From simple 2-D scatter plots to compelling contour and the new radar and dot density plots, SigmaPlot gives you the exact technical graph type you need for your demanding research.
Use Global Curve Fitting to simultaneously analyze multiple data
Global curve fitting is used when you want to fit an equation to several data sets simultaneously. The selected equation must have exactly one independent variable.
Obtain Data from Nearly Any Source
SigmaPlot has import file formats for all common text files. This includes a general purpose ASCII file importer which allows importing comma delimited files and user-selected delimiters.
SigmaPlot Features
Choose from a wide range of graph types to best present your results
From simple 2-D scatter plots to compelling contour and the new radar and dot density plots, SigmaPlot gives you the exact technical graph type you need for your demanding research.


Statistical Analysis is no longer a daunting task
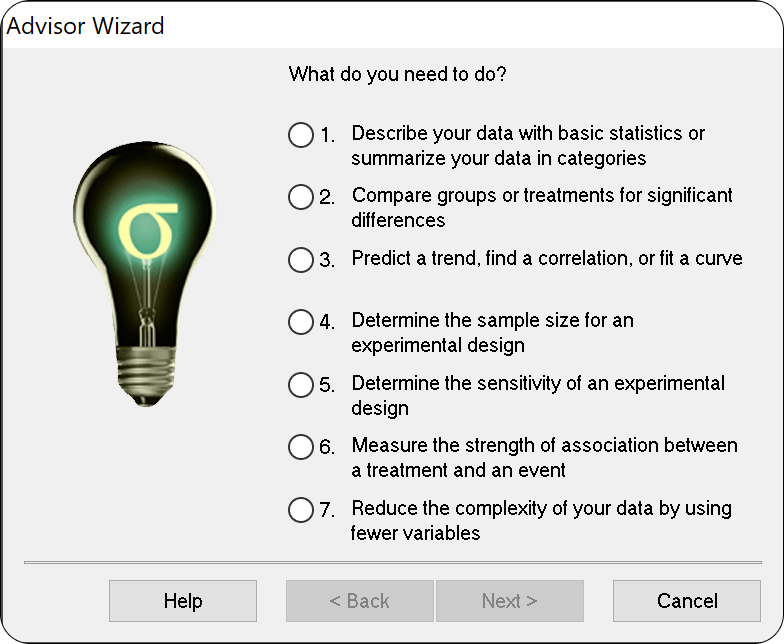
SigmaPlot now offers almost 50 of the most frequently used statistical tests in scientific research by integrating SigmaStat into one application.
