
SigmaPlotng Foundation Edition
A Revolution in Scientific Data Analysis
Are you ready to take your scientific data analysis to the next level? Say hello to SigmaPlotng – the latest and most innovative version of Sigmaplot yet!
Available on


Overview
SigmaPlotng Foundation: A Revolution in Scientific Data Analysis
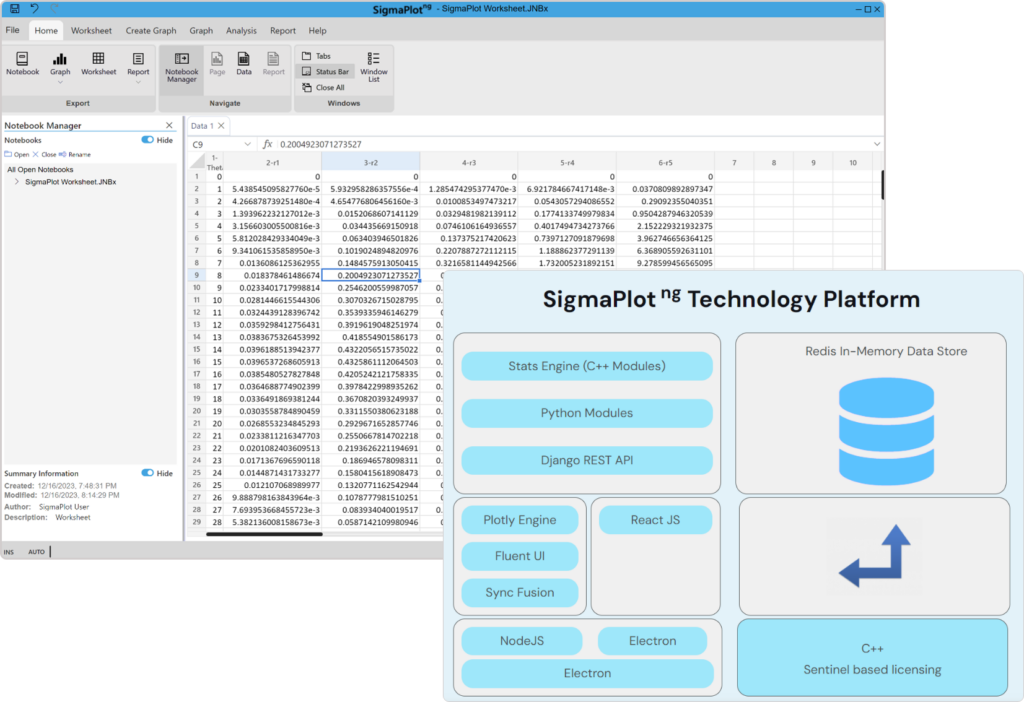
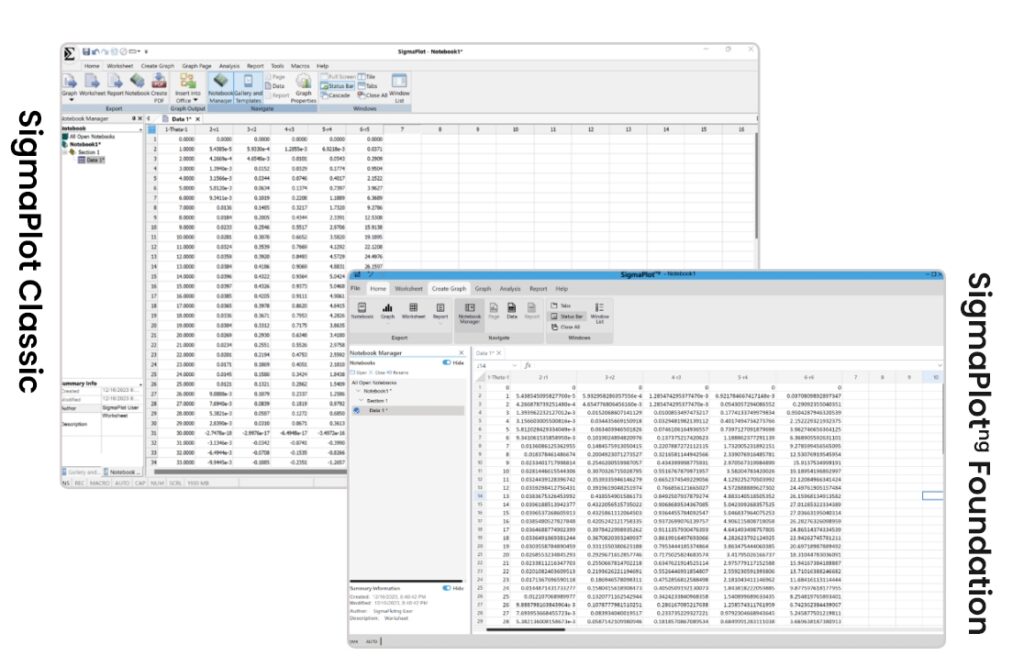
Are you ready to take your scientific data analysis to the next level? Say hello to SigmaPlotng – the latest and most innovative version of Sigmaplot yet! SigmaPlotng combines the familiar look and feel of previous versions with a complete technological overhaul under the hood, resulting in a truly groundbreaking product.
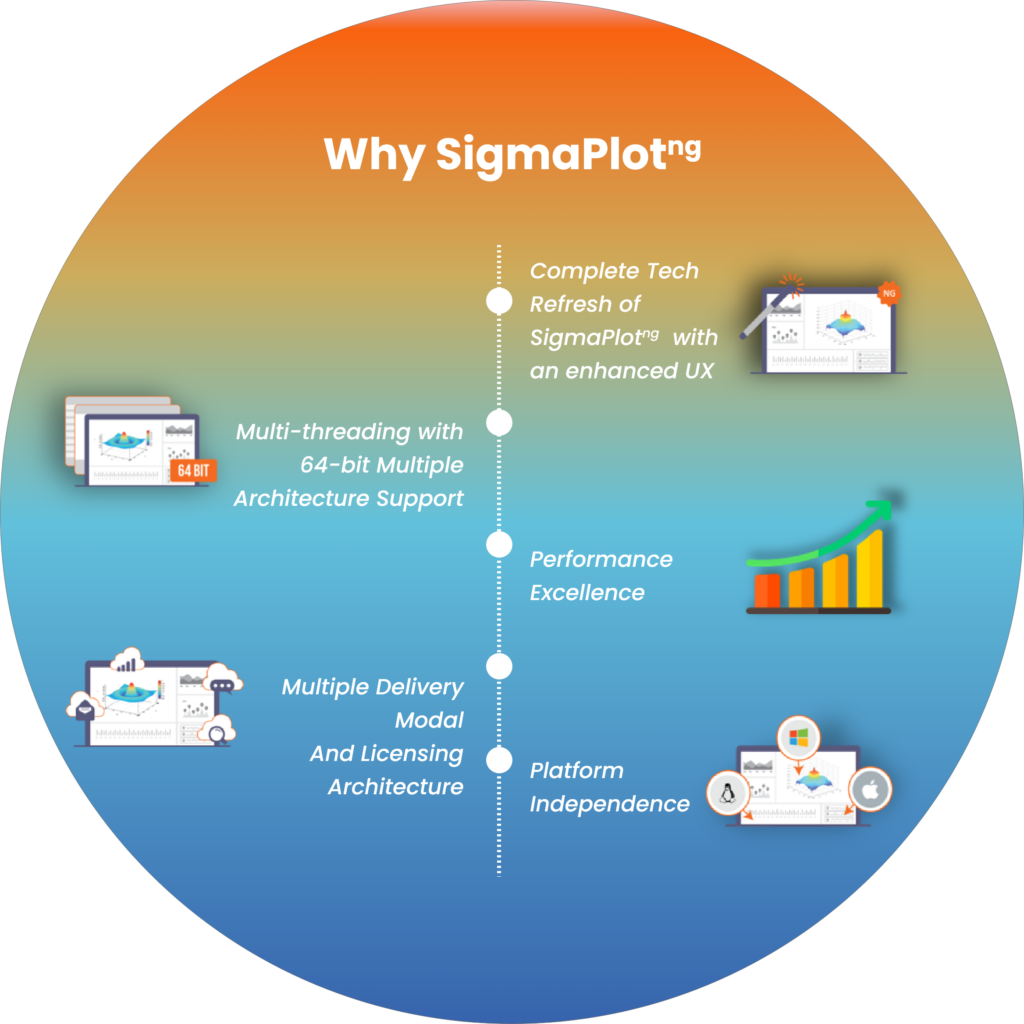
SigmaPlotng Foundation is a cross platform tool, which allows users the flexibility to use on multiple operating systems or devices.
Effortless Installation
SigmaPlotng harnesses the power of 64-bit technology, allowing you to work with larger datasets and effortlessly import/export massive data files. This version is optimized for modern processors and GPUs, ensuring efficient utilization of your hardware resources.
64-bit Power
Installation has never been easier! Mac users can enjoy a one-click install, while Windows users will find the installation process simpler and more user-friendly than ever before. Plus, SigmaPlotng is faster, thanks to performance enhancements that accelerate data analysis.
Multi-threaded Support
SigmaPlotng takes full advantage of multi-threaded capabilities on newer processors and GPUs, delivering enhanced performance for your data analysis tasks. It also seamlessly integrates with standard libraries like JDBC for access to cutting-edge technologies.
Enhanced Accessibility
Accessibility is a top priority with SigmaPlotng. We’ve improved support for screen readers and keyboard navigation to make data analysis accessible to all users. Additionally, we’ve eliminated the need for multiple MFC runtime libraries, reducing dependencies and potential installation issues.
Data Integrity and Security
To enhance the quality of scientific research, SigmaPlotng offers password support with an audit trail to protect data integrity. You can track and revert changes made to protected worksheets, ensuring the accuracy and security of your data.
Key Features in SigmaPlotng Foundation v1.0
GraphTypes
2D Types
- Scatter (11Types), Line (12 Types), Scatter and Line (15 Types)
- Vertical and Horizontal Bar (4 Types), Grouped Bar (4 Types)
- Vertical Stacked Bar
- Area Plots (4 Types)
- Radar (4 Types)
- Box (2 Types)
- Polar (3 Types)
- Contour, line and filled (2 Types)
- Histogram
- Ternary (3 Types)
- Bubble, Pie
- Heat Map
- Geographical Maps
Statistical tests
- Descriptive statistics
- One Way Frequency Tables
- One Sample t-test
- One Sample Signed Rank test
- t-tests, Rank Sum Test
- One-way, two-way, three-way ANOVA
- ANOVA on Ranks
- One Way Analysis of Covariance (ANCOVA)
- Paired T-Test
- Signed Rank Test
- One Way, Two Way Repeated measures ANOVA
- Repeated measures ANOVA on Ranks
- Z-test, chi-square, Fisher Exact Test, McNemar’s Test, Relative Risk, Odds Ratio
- Linear, Stepwise, Best Subset, Polynomial, Multiple Logistic, Multiple Linear, Deming
- Principal Components Analysis (PCA)
- Correlation -> Pearson Product Moment, Spearman Rank Order
- Survival analysis (Kaplan-Meir – Single Group, Log Rank, Gehan Breslow)
- Survival analysis (Cox Regression – Proportional Hazard, Stratified Model)
- Normality
3D Types
- Scatter,
- Line – Trajectory
- Mesh
- Waterfall
Transform
- Quick Transform
- User Defined Transform
- Statistical Transform
Statistical Advisor
- Advisor Wizard guides through the process of choosing the appropriate statistical test
Statistical Result Graph
- Result graphs for appropriate statistical test result.
Statistical Report
- Ability to change the report background color
- Insert tables with pre-defined styles or customize completely
- Zoom enabled report
- Bookmarks/Table of contents: User should be able to create bookmarks, by specifying portions of texts as reference/placeholder.
- Page header/Footer/page number: User should be able to add header/footer and page number at the bottom of the page.
- Page Setup: User should be able to specify the page configuration, page layout, margins and size.
- Page Break: User should be able to insert page breaks.
- Insert footnotes/endnotes: User should be able to add footnotes and endnotes to the document editor.
- Background Images – User should be able to insert images as Backgrounds/Watermarks.
- Property panel – context editing: User should be able to use the property panel based on the Report feature selected (Property Panel for text will be different from tables)
Data Worksheet Import
- Directly import SAS data sets (.sd2 and .sas7bdat files)
- Directly import Minitab data sets (.mtw & .mpj files)
- Open ASCII Plain, CSV and general import filter like Excel(.xls, .xlsx)
- Import any ODBC compliant database
- Run SQLqueries on tables and selectively import information
- Opens R, Statistica, Matlab, Stata, JMP files
- JDBC support to (Addition to ODBC) Import database
Data Worksheet
- Formula bar- Edit/enter the cell values through a formula bar directly.
- Formulas- To apply formula to the cells.
- Insert color, symbols and line styles
- Cell display formats
- Format content of the cells
Data Worksheet Export
- SAS files (.sd2 files)
- Minitab files (.mtw & .mpj files)
- ASCII Text, Tabbed, Comma, Excel, DIF,
- PDF, PSD and HTMLexport of graphs and reports
- R, Statistica, Matlab, Stata, JMP files
OUR PREMIUM WORDLWIDE RESELLERS

Hearne
Seller of discounted SigmaPlot NG student and faculty software. 24x7 FREE live chat, phone and email technical support by experienced consultants.
Sales Worldwide
24/7 support

OnTheHub (Kivuto)
Access to free or heavily discounted software, e-texts and other resources for students, faculty and staff.
Extended support services.
Sales Worldwide
Extended Support
For other resellers Click Here.


