Content
Ready to Explore Violin Plots?

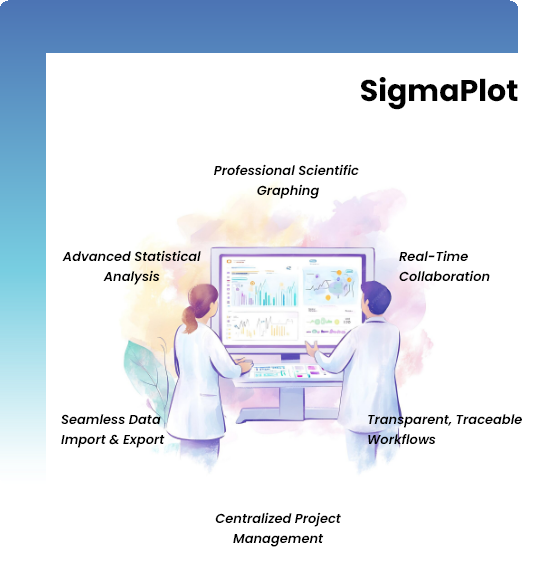
Discover innovative strategies and utilize the latest techniques.

SigmaPlot 16 makes it easy to create and customize violin plots. Download a free trial today and start visualizing your data like never before.

介绍SigmaPlot v16

SigmaPlot 是一款先进的数据分析和绘图软件,旨在帮助您创建精确的、具有出版品质的图形和图表。它超越了标准的电子表格,提供 100 多种 2-D 和 3-D 图形类型,从简单的散点图到复杂的雷达图和等高线图。直观的用户界面具有 Microsoft Office 风格的功能区控件和可定制的快速访问工具栏,使数据的编辑和可视化变得快速而简单。您几乎可以从任何来源获取数据,支持各种文件格式,包括 Microsoft Excel、SPSS、SAS 和 ODBC 数据库,确保无缝集成到您的工作流程中。

除了强大的可视化功能,SigmaPlot 还提供了一套全面的统计分析工具和自动化功能,以简化您的研究工作。它整合了 SigmaStat 的咨询统计功能,可指导您完成近 50 种最常见的科学统计测试,并根据您的数据推荐适当的分析方法。该软件还包括功能强大的回归向导和动态曲线拟合器,确保结果准确可靠。只需点击鼠标即可创建宏,从而实现重复性任务的自动化。SigmaPlot 集强大的绘图功能、稳健的分析和无缝集成于一身,是研究人员和科学家不可或缺的工具。

为何选择SigmaPlot

无与伦比的科学可视化精度

SigmaPlot 具有精确、出版质量高的图表、全面的数据分析和强大的演示工具,使您能够准确地展示您的研究结果。

它具有多种科学功能,包括自动误差条、回归线、 置信区间、坐标轴中断、技术坐标轴刻度、非线性曲线拟合,以及功能强大的 数据工作表,可实现无缝数据处理。

将数据转化为令人信服的 科学叙述

SigmaPlot 可将原始数据转化为精美的出版级图表, 。SigmaPlot 提供广泛的自定义选项,从 复杂的配色方案到灵活的数据组织,让您可以 制作引人入胜的视觉叙事。

将创作无缝导出为各种格式,将其整合到 PowerPoint 演示文稿中,或直接从应用程序中进行共享

协作。用 SigmaPlot 简化

SigmaPlot 可简化与同事的协作,并简化与世界共享 研究成果的过程。将讨论和 反馈集中起来,消除混乱的电子邮件线程,从而提高效率。

发布您的作品,安全地邀请他人查看您的 项目并提供反馈,同时保持对宝贵数据访问的完全控制

利用 SigmaPlot 做出更准确、更明智的 分析选择

SigmaPlot 可将原始数据转化为精美的出版级图表, 。SigmaPlot 提供广泛的自定义选项,从 复杂的配色方案到灵活的数据组织,让您可以 制作引人入胜的视觉叙事。

SigmaPlot 新功能

从多种图表类型中进行选择,以最佳方式呈现结果

释放数据的力量:介绍 SigmaPlot 16

此次升级提供了突破性的功能,旨在简化您的研究工作流程,增强您的数据可视化 能力。

Features
Butterfly Plot

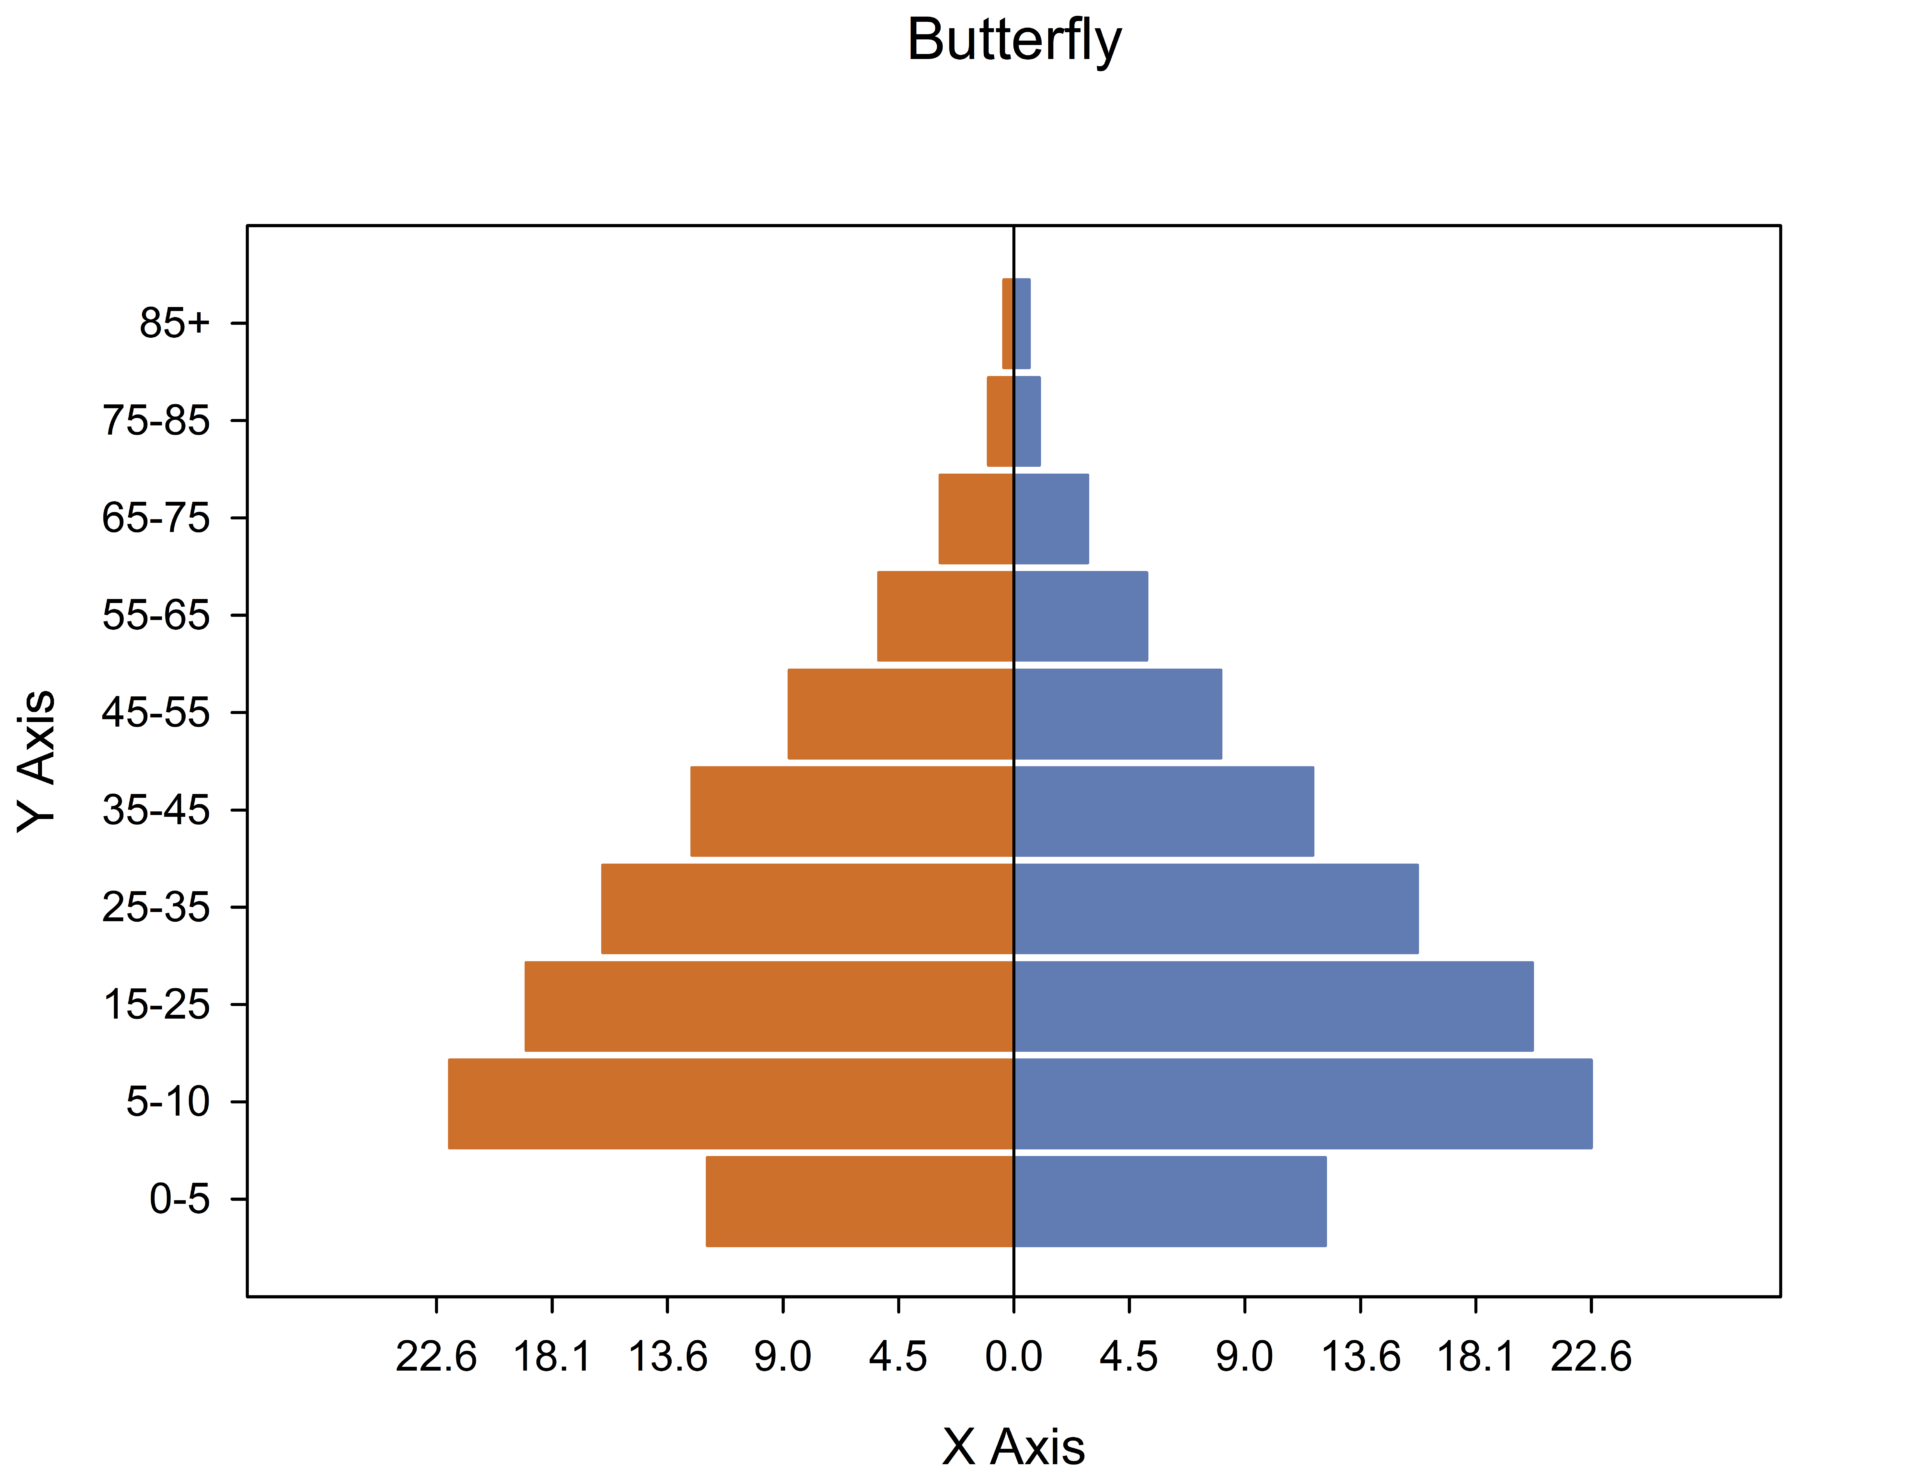
Butterfly Plot- a butterfly plot (also sometimes called a tornado or pyramid chart) is a type of bar chart used to compare two datasets side-by-side.

Import Multiple Excel Sheets

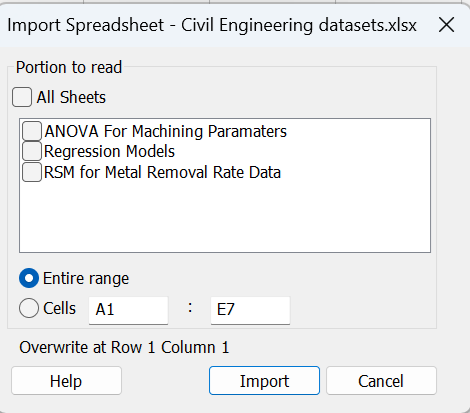
Macro to allow importing of all sheets of an Excel file – SigmaPlot v16 has a macro that will accept multiple worksheets from an Excel Workbook.

Violin Plots

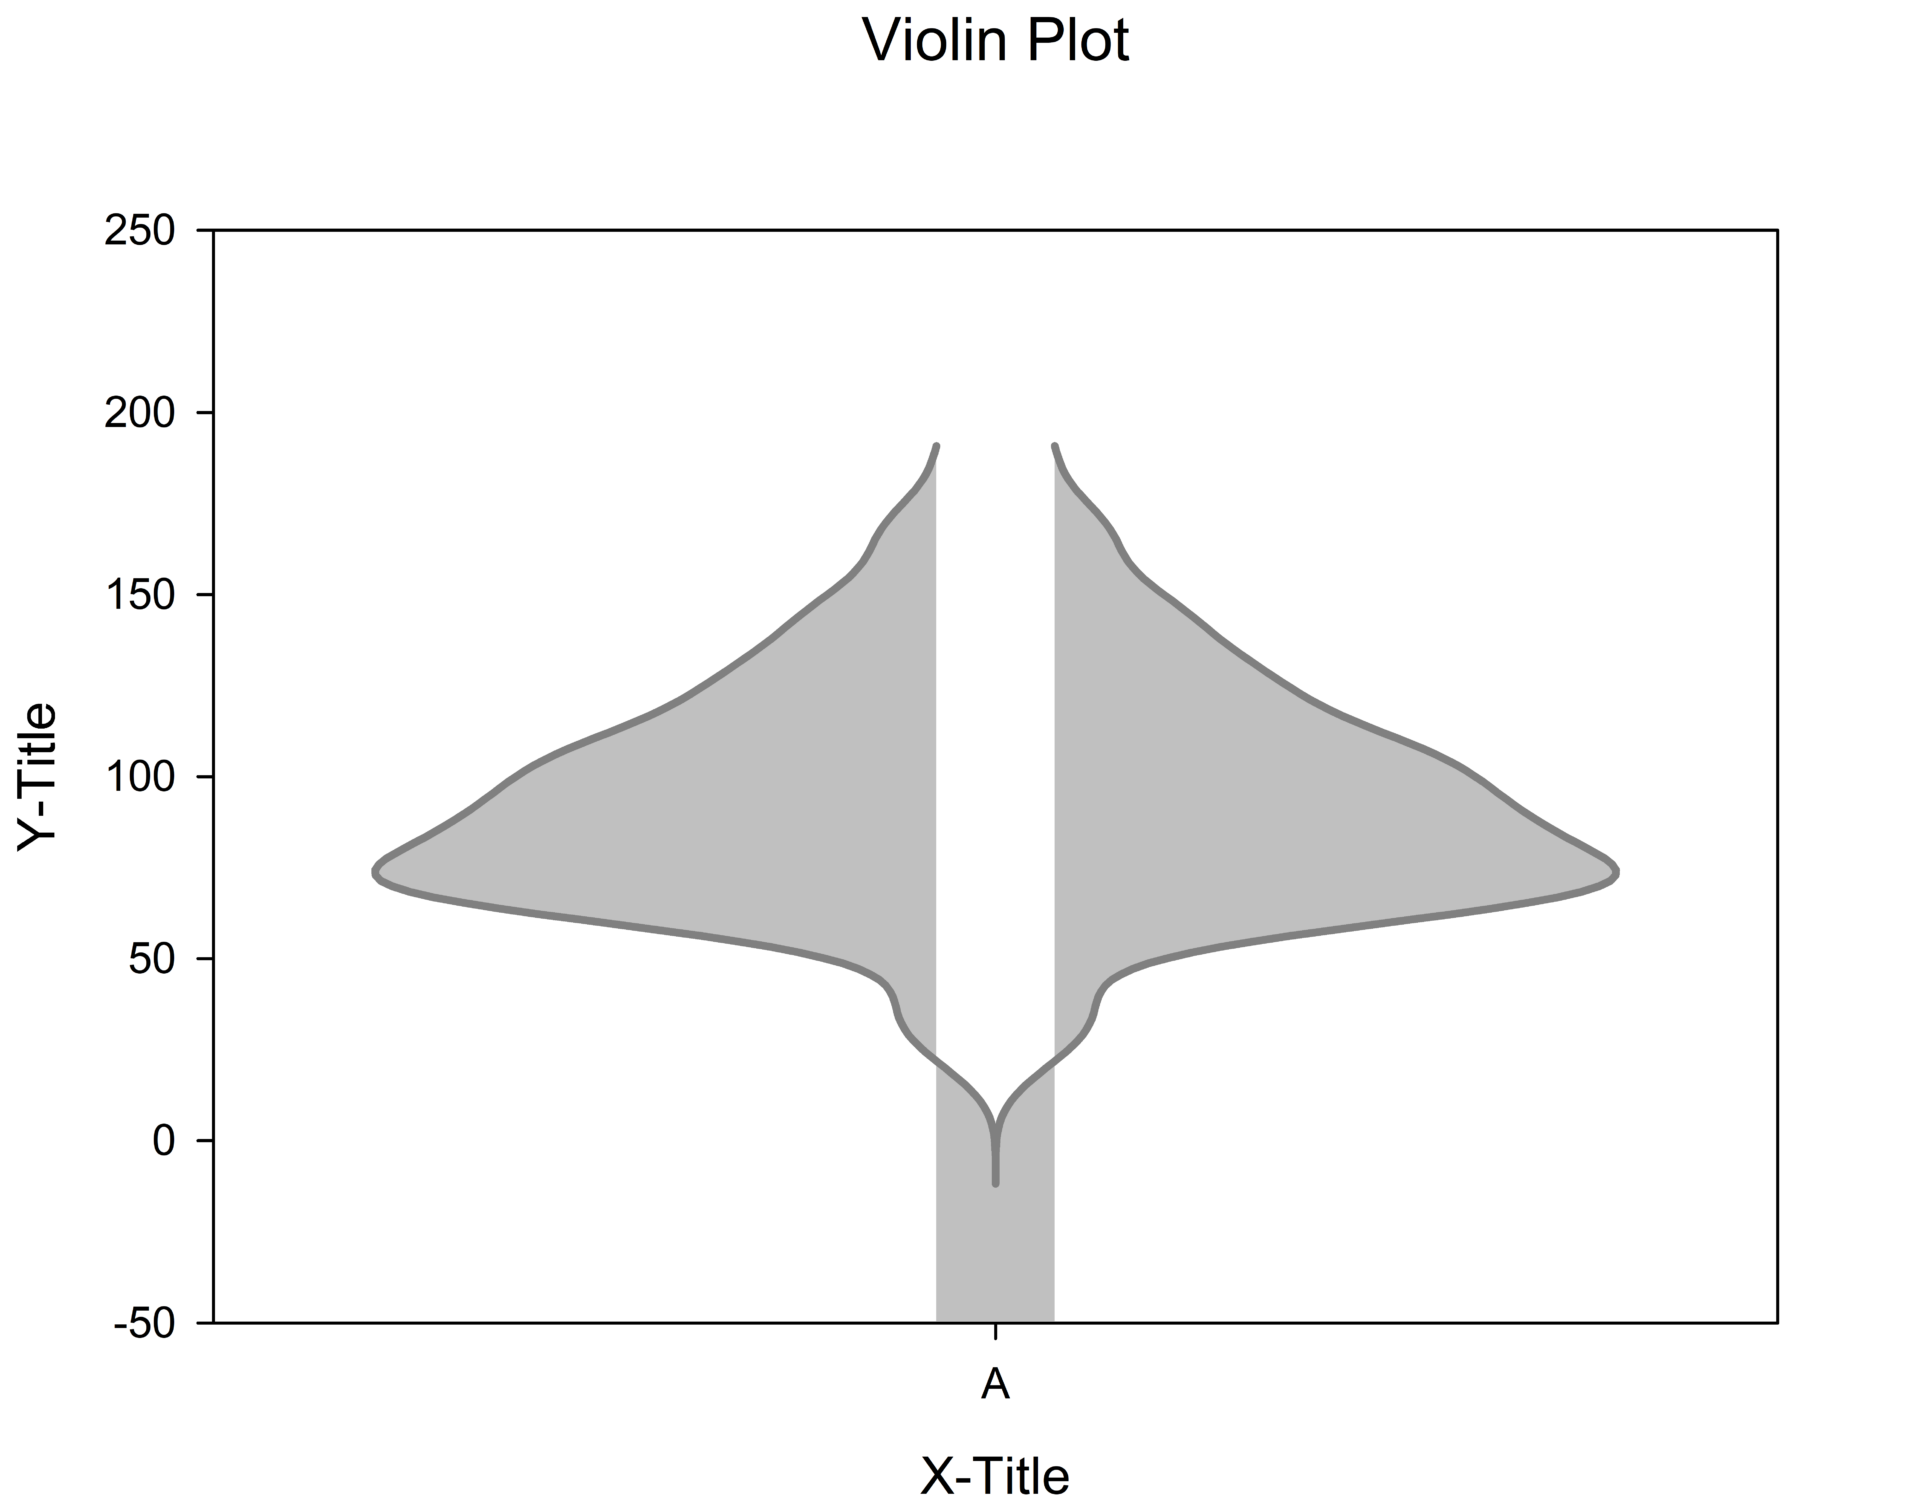
Violin Plots – are used to depict the distribution of numerical data for one or more groups. They provide the option to combine the kernel density curves, with box plots offering a more informative view of the data compared to a box plot alone.

Error Bands

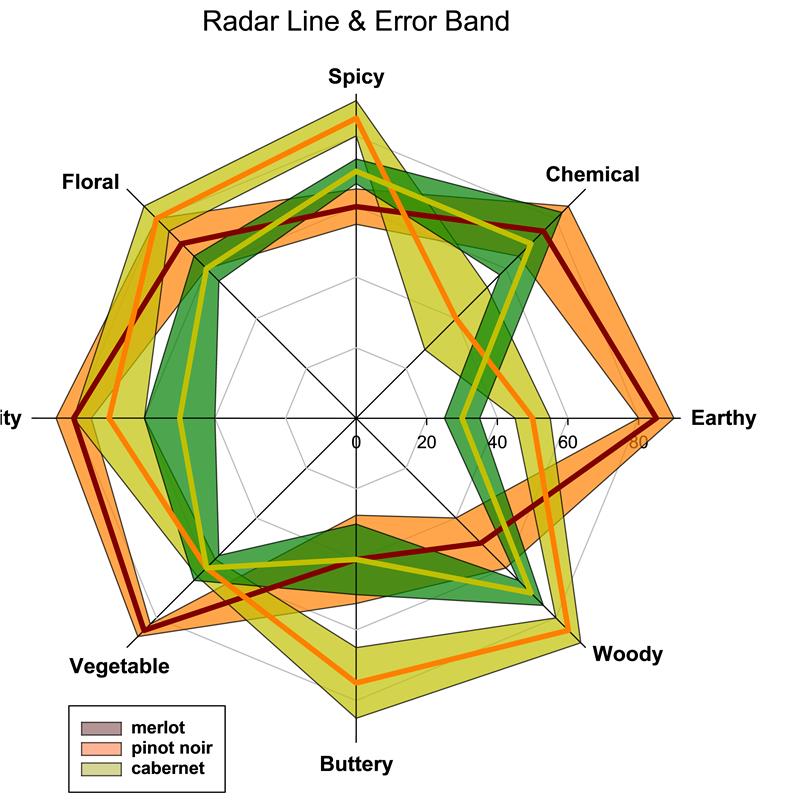
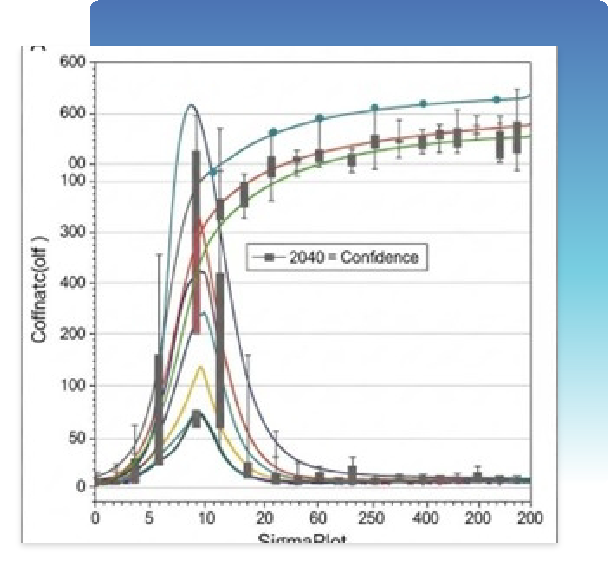
Error Bands - Error bands, also sometimes called error bars, are graphical representations of the variability or uncertainty associated with a data point or an estimated relationship in a graph. They are often used in various scientific and statistical visualizations.

联系我们

我们希望收到您的来信!请使用我们方便的联系表 直接给我们留言。您也可以通过 电话 (800)-797-7401 或电子邮件 info@grafiti.com 联系我们,或访问 ,地址为 405 Waverley St, Palo Alto, CA 94301。

购物车
Scroll to Top